Data Exploration
Assignment Overview
Your goal is to explore a single dataset and write an analysis of the dataset on your website. Your write-up will have two sections:
- Data biography: analyze the basics of how the dataset was created.
- Analysis and visualization of the dataset’s contents.
I have assigned you a specific dataset depending on what section of the course you are enrolled in. I have not provided any other information about the datasets other than the below links to get you started.
- HIST students:
Eastern State Penitentiary Admission Book A: - COMM students:
Netflix Movie and TV Shows:
Assignment Goals
- Understand how data is produced and some of the historical, social, and cultural contexts that shape its production
- Develop skills in analyzing and visualizing datasets using Tableau Public
- Practice how to effectively communicate information using data
Section 1: Data Biography
In the first part of your post you will write a “data biography” of the dataset (I borrow this term from Heather Krause). I am not providing you with any additional information about the dataset beyond the above links. You will need to put on your detective hats and try to familiarize yourself with the data and its creation. Make sure that you download the actual dataset and take a look at its contents in addition to exploring the links above. Many of the following questions have multiple answers that you will need to include in order to provide a full explanation. Note: you may need to Google things to find out all of this information.
- Introduce the dataset and its contents. Use a screenshot or two to illustrate some of its features or contents.
- Where did it come from? What was the original source? What is the source that you got it from?
- When was it produced?
- Who collected it? Who collected the original information? Who put together the actual dataset?
- How was it collected? What was the process of finding, creating, or processing it?
- Why was it collected? What seemed to be the motivation behind and who is its intended user?
Section 2: Data Analysis and Visualization
You will then use Tableau Public to explore the contents of the dataset in more depth. Once you have a handle on the different kinds of information contained in the dataset, choose a specific aspect of the data to analyze and visualize in some way (chart, map, etc.). Communicate your findings through a combination of written explanation and at least 1-2 embedded Tableau Public visualizations in your post.
Instructions for embedding a Tableau Public sheet into Wordpress:
- While editing your page insert a new block and select
Custom HTMLfor the block type (you can use the search bar in the visual editor). - Publish your Tableau Public workbook by going to File -> Save to Tableau Public.
- Open up your Tableau Public workbook in a browser rather than the desktop app.
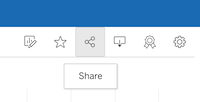
- Click on the Share button:

- Select ALL of the text in the box under Embed Code that starts with
<div class=and copy it - Paste the Embed Code text into your
Custom HTMLblock in your Wordpress page. It should look like a bunch of jumbled text that starts with<div class=. This is the Javascript code that is going to allow you to display your Tableau visualization inside a webpage. - When you publish the page you should see an interactive Tableau visualization appear on your page.
Submit a URL of your page on Canvas by Sun. 4/16 at 11:59PM
