The County Problem in the West
Happy GIS Day! Below is a version of a lightning talk I’m giving today at Stanford’s GIS Day.
Historians of the American West have a county problem. It’s primarily one of geographic size: counties in the West are really, really big. A “List of the Largest Counties in the United States” might as well be titled “Counties in the Western United States (and a few others)” - you have to go all the way to #30 before you find one that falls east of the 100th meridian. The problem this poses to historians is that a lot of historical data was captured at a county level, including the U.S. Census.
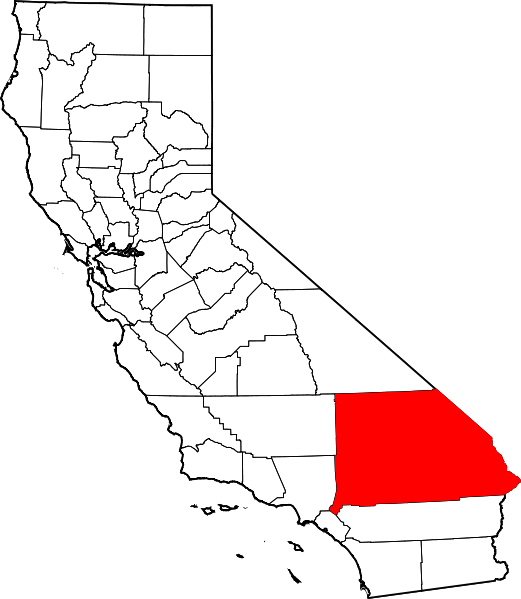
San Bernardino County is famous for this - the nation’s largest county by geographic area, it includes the densely populated urban sprawl of the greater Los Angeles metropolis along with vast swathes of the uninhabited Mojave Desert. Assigning a single count of anything to San Bernardino county to is to teeter on geographic absurdity. But, for nineteenth-century population counts in the national census, that’s all we’ve got.
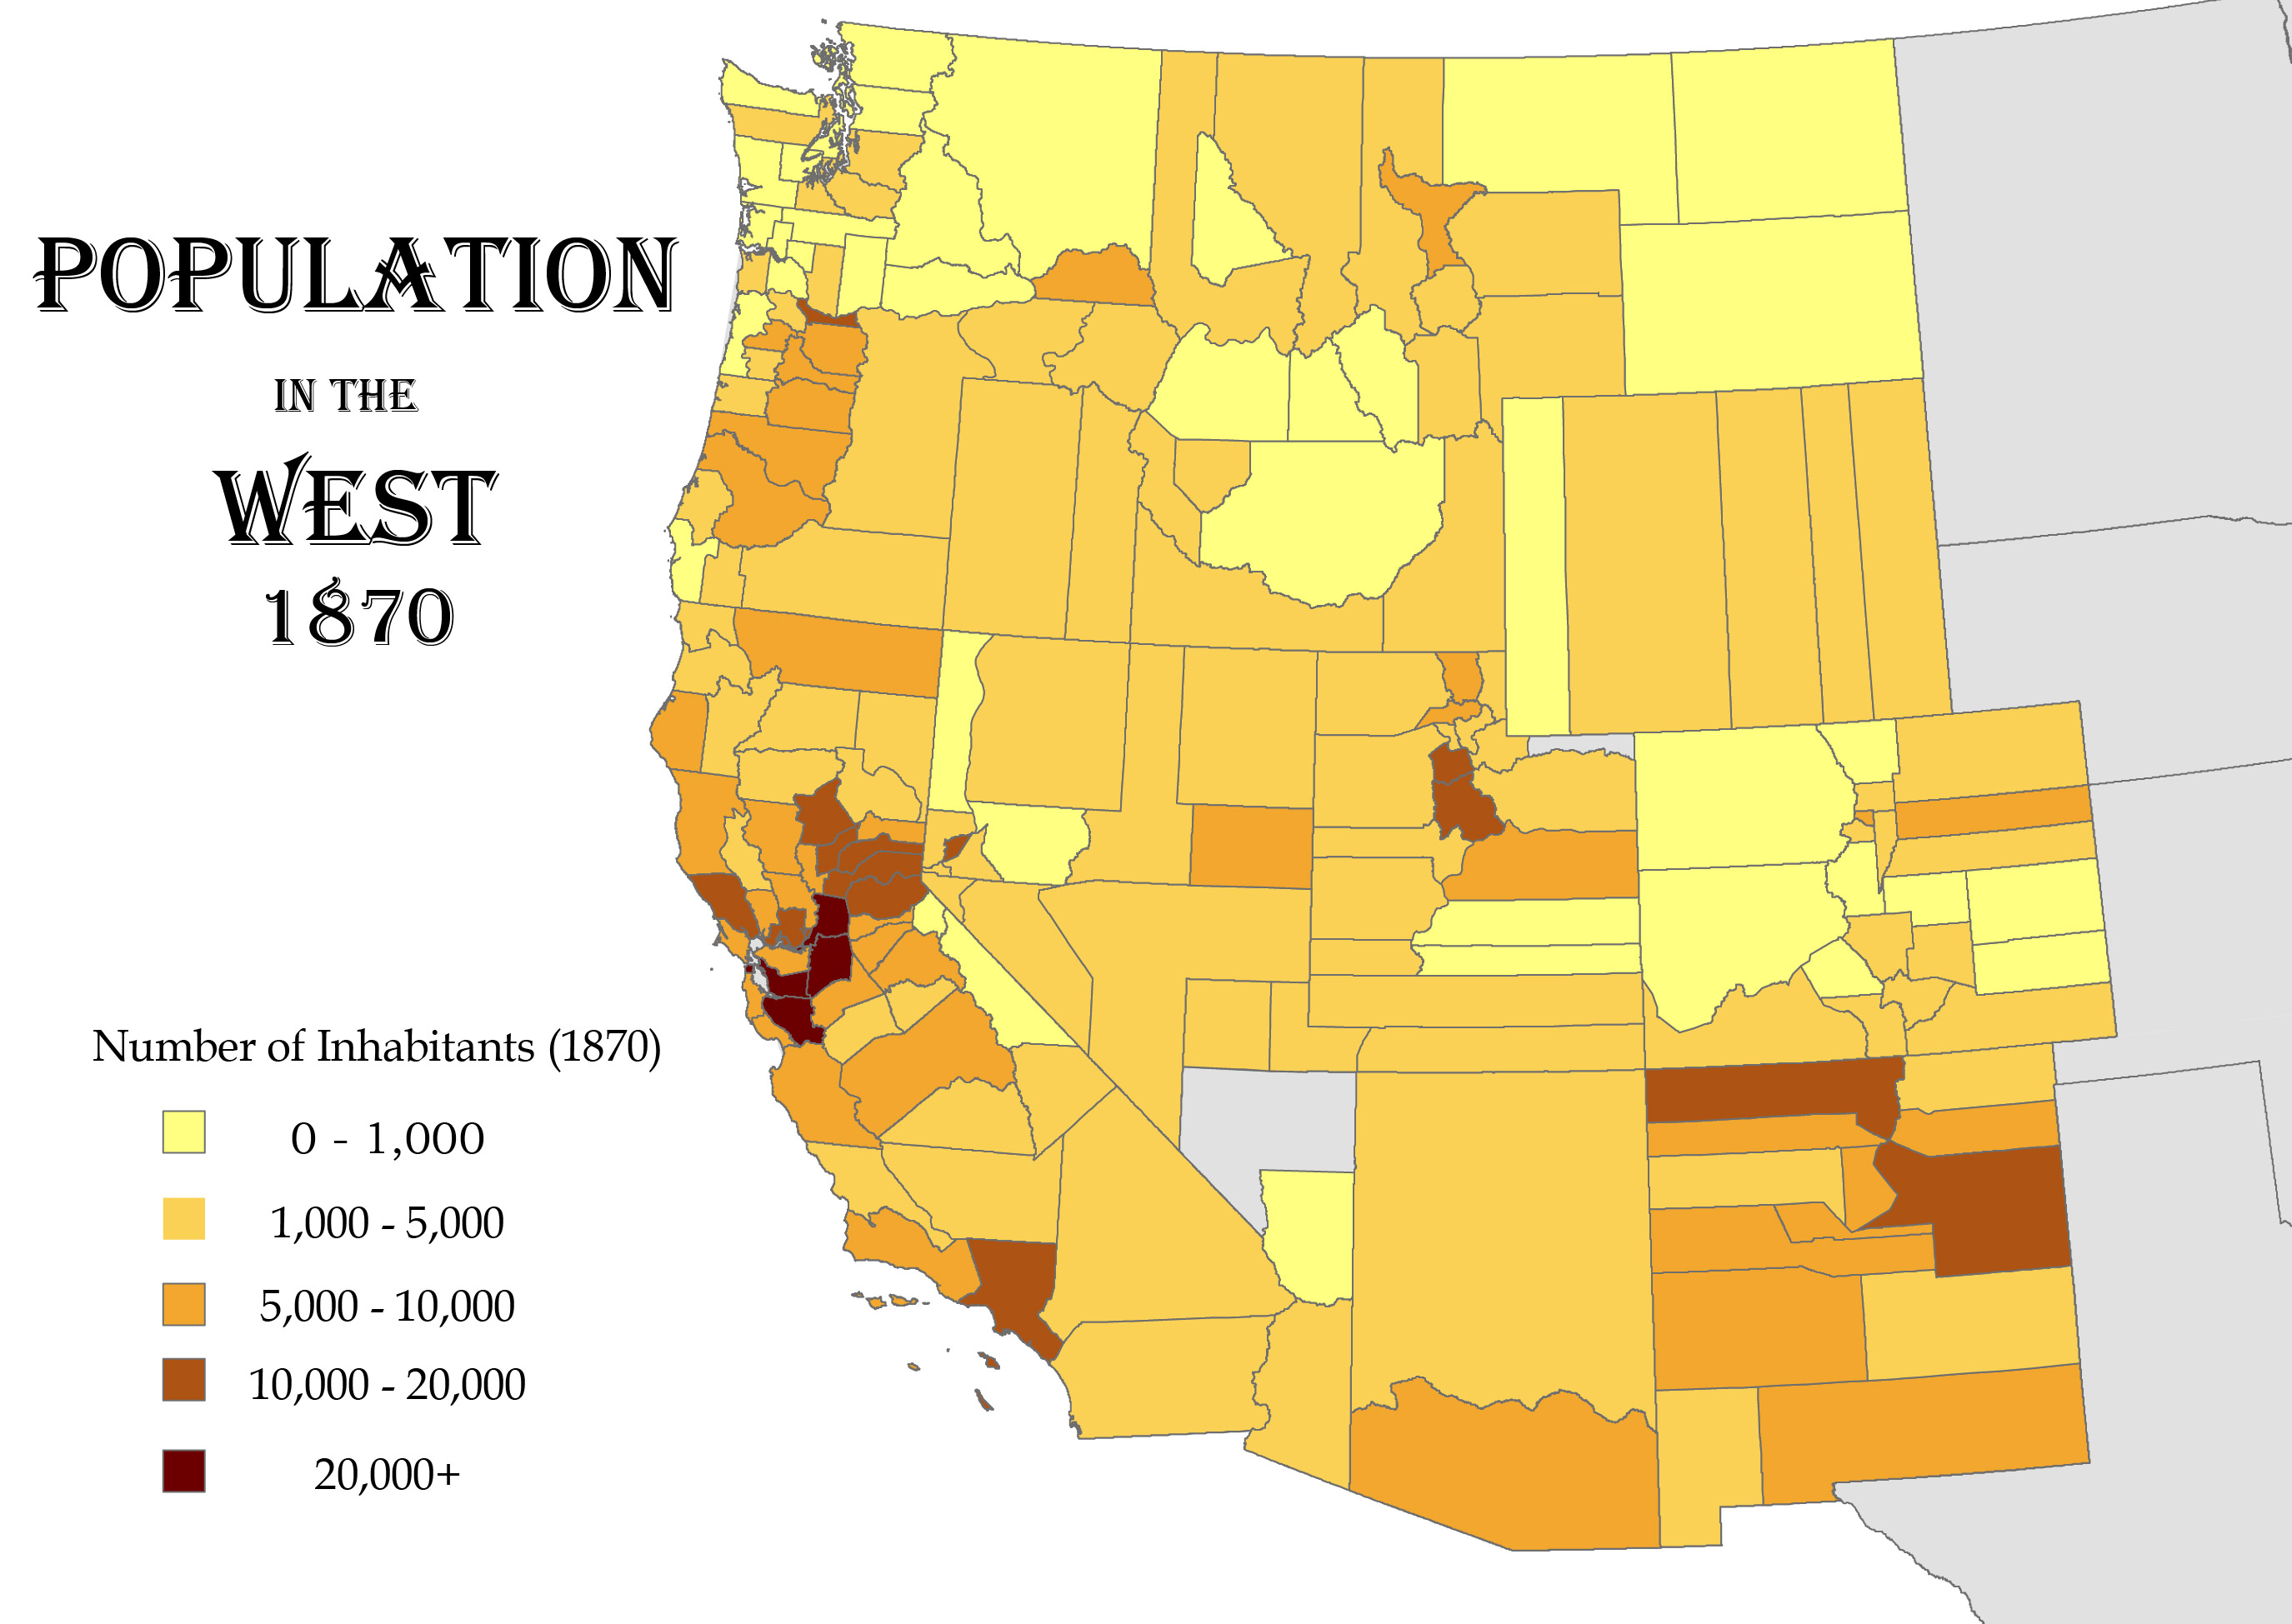
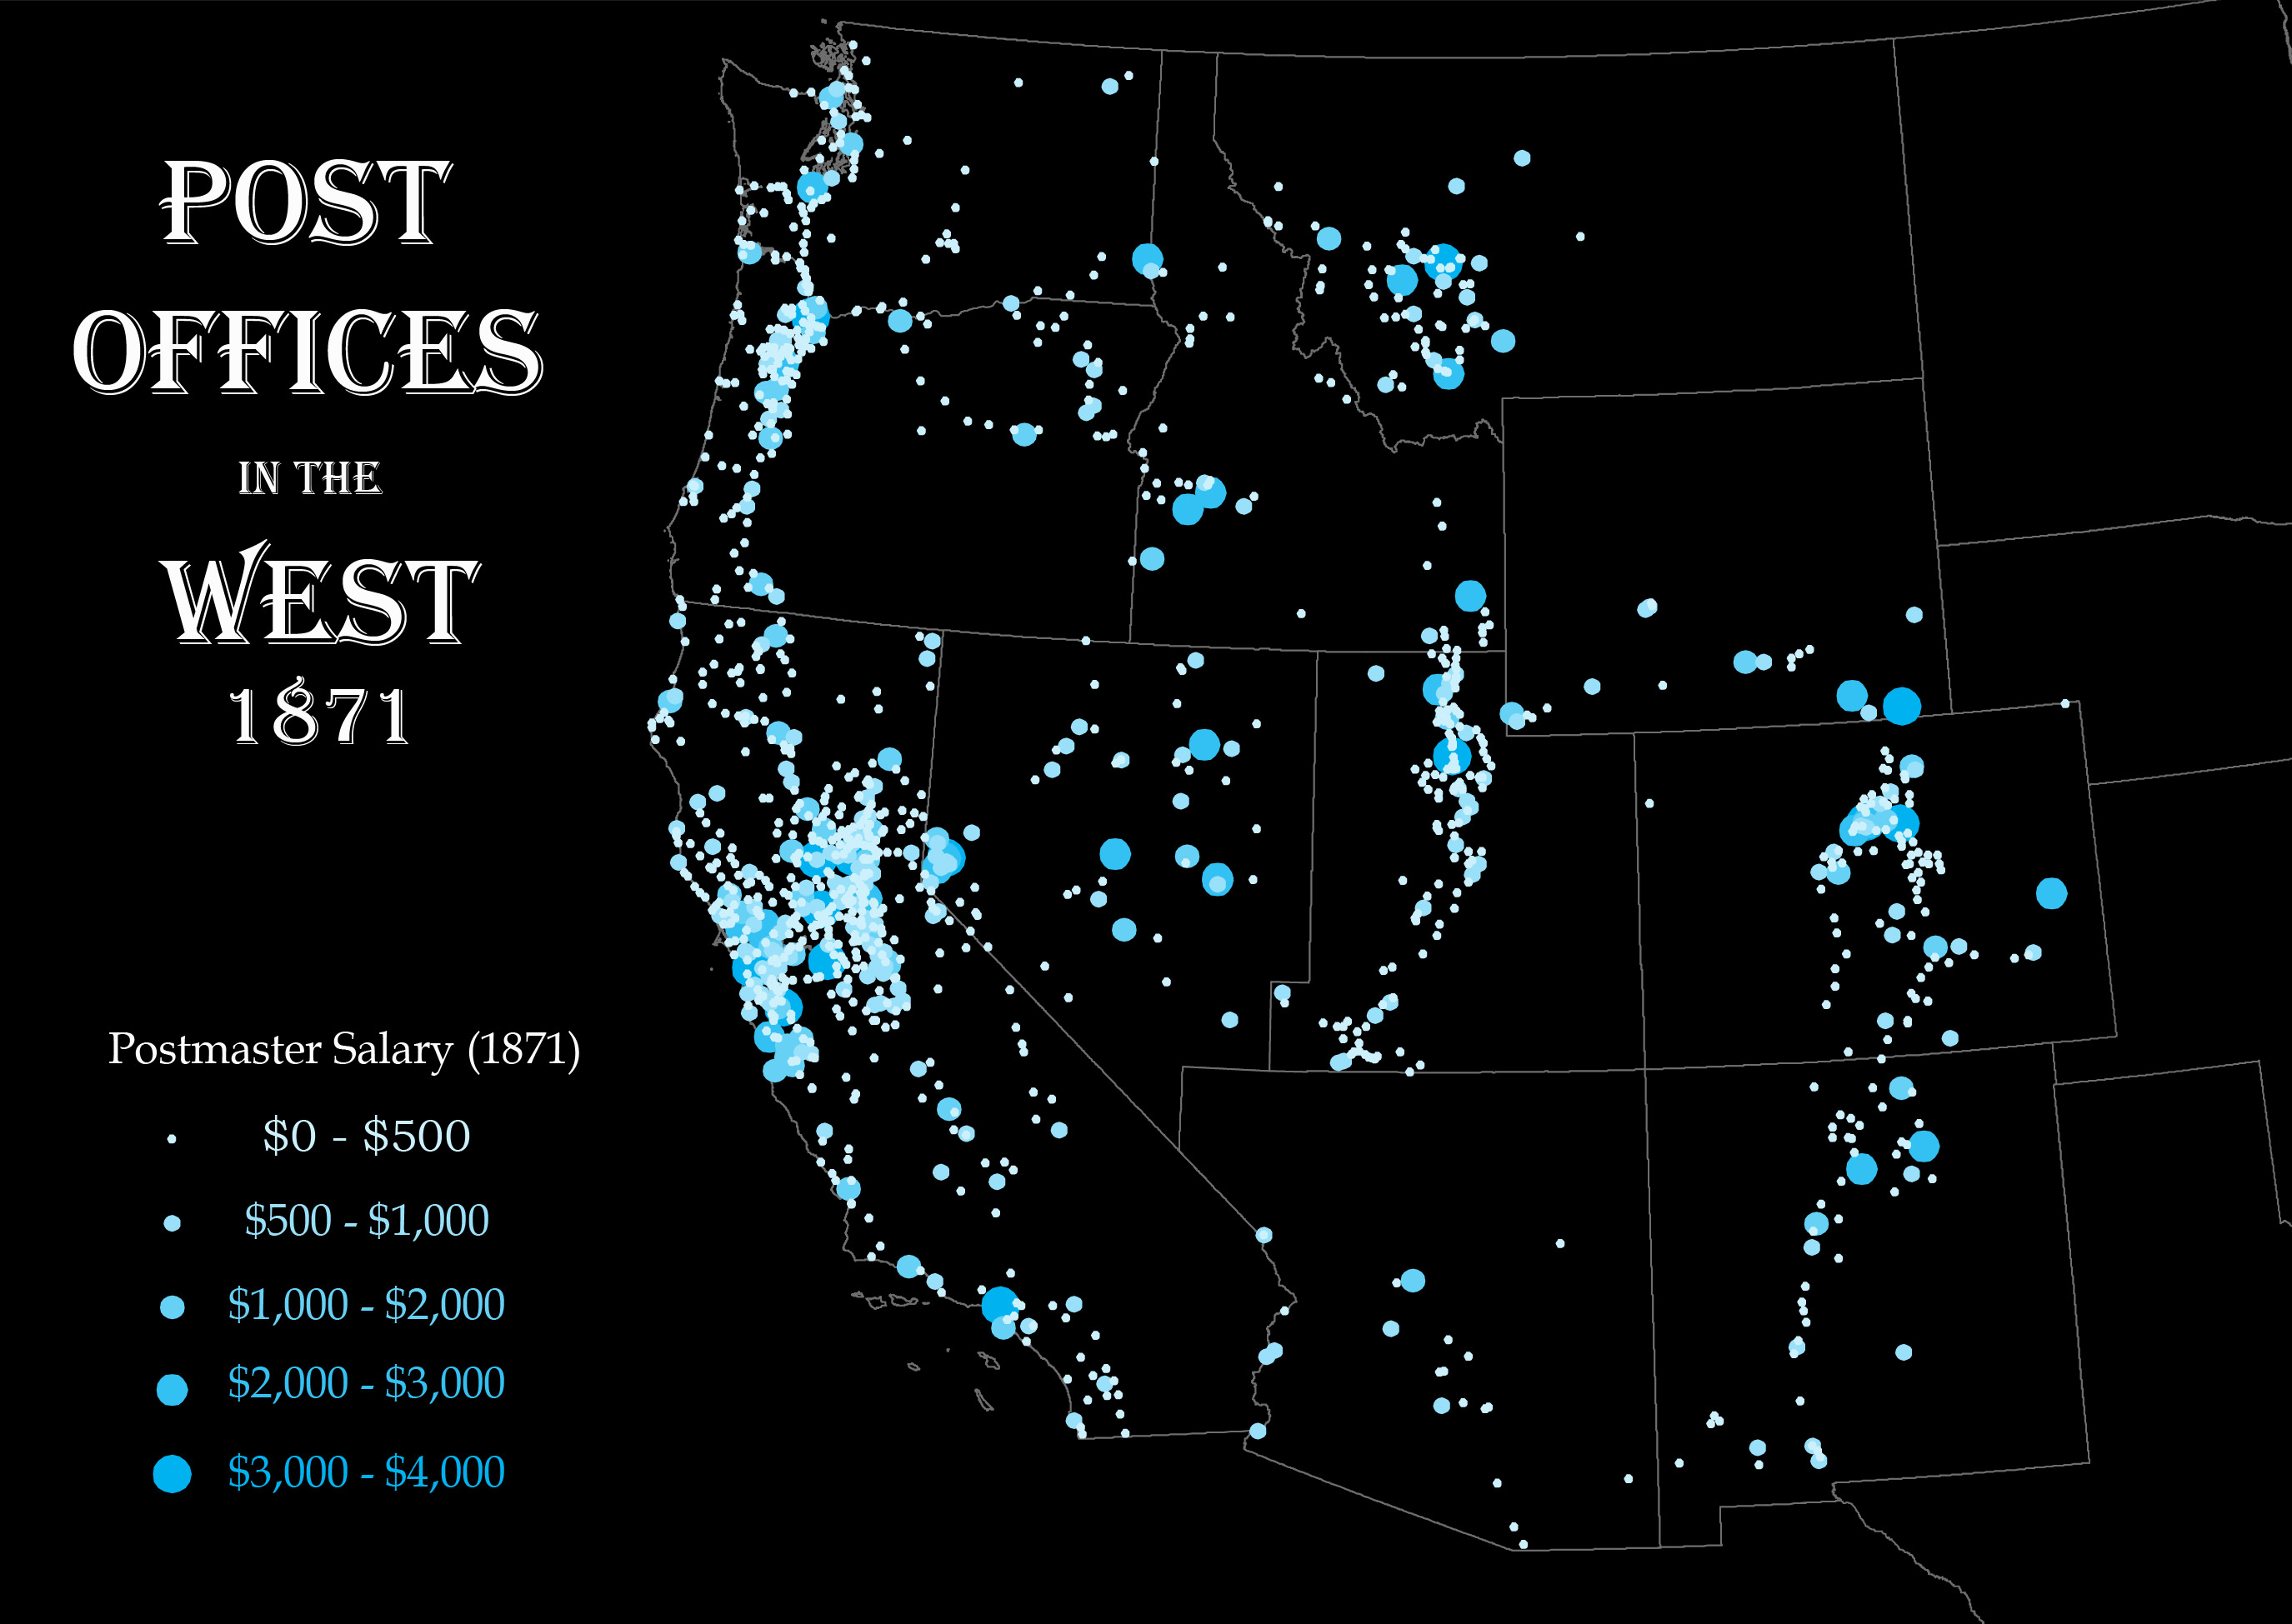
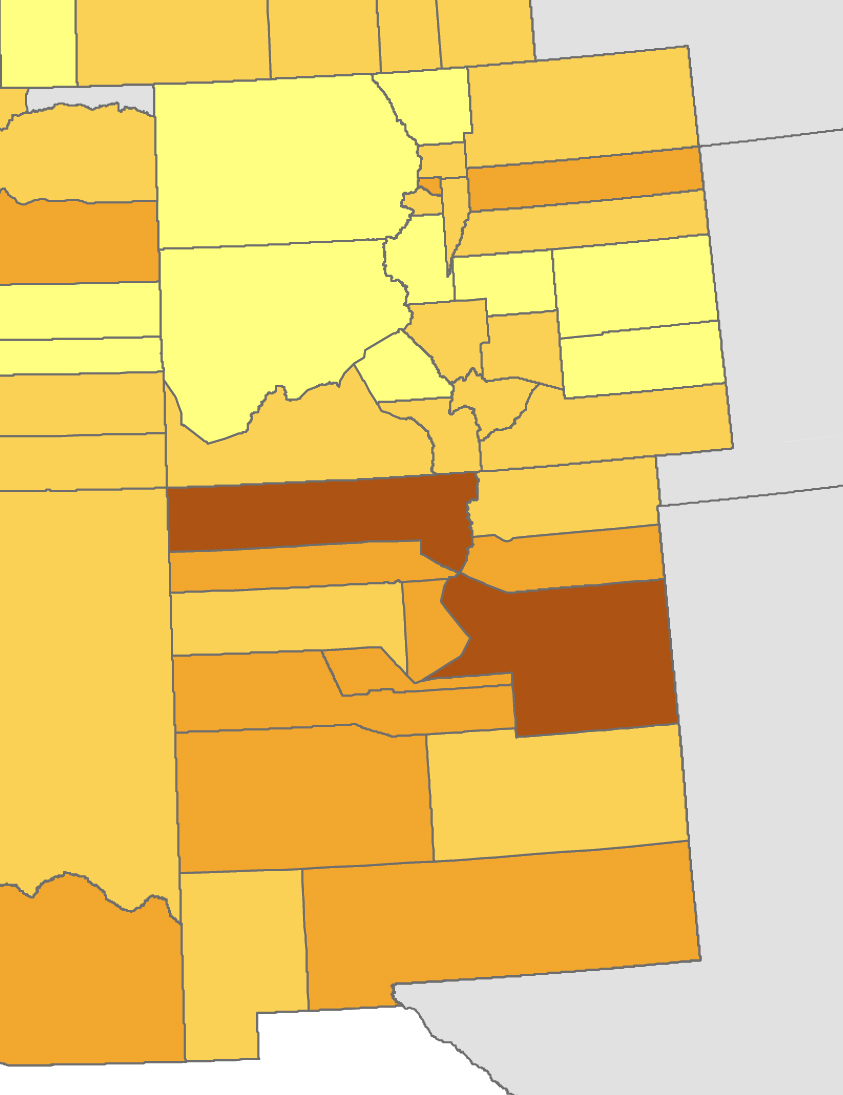
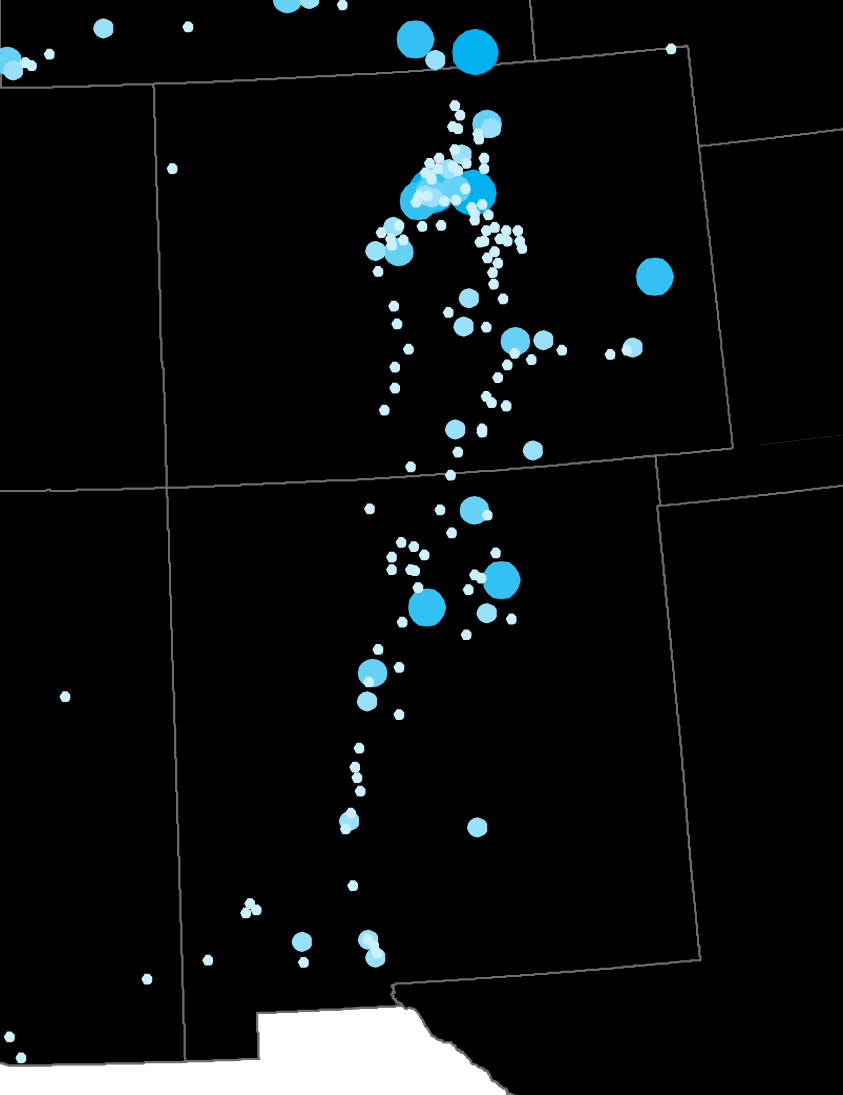
Here’s a basic map of population figures from the 1870 census. You can see some general patterns: central California is by far the most heavily populated area, with some moderate settlement around Los Angeles, Portland, Salt Lake City, and Santa Fe. But for anything more detailed, it’s not terribly useful. What if there was a way to get a more fine-grained look at settlement patterns in these gigantic western counties? This is where my work on the postal system comes in. There was a post office in (almost) every nineteenth-century American town. And because the department kept records for all of these offices - the name of the office, its county and state, and the date it was established or discontinued - a post office becomes a useful proxy to study patterns over time and space. I assembled this data for a single year (1871) and then wrote a program to geocode each office, or to identify its location by looking it up in a large database of known place-names. I then supplemented it with the the salaries of postmasters at each office for 1871. From there, I could finally put it all onto a map:
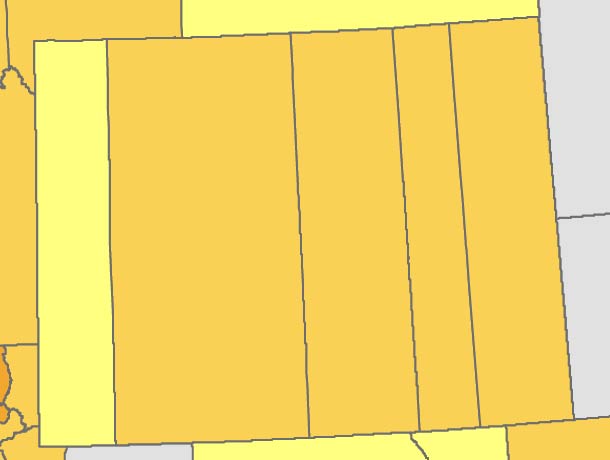
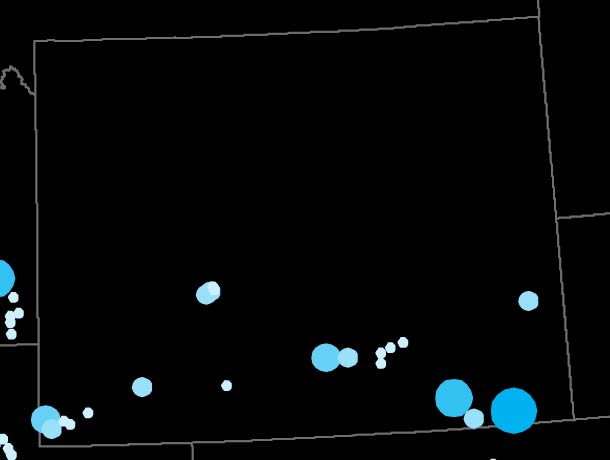
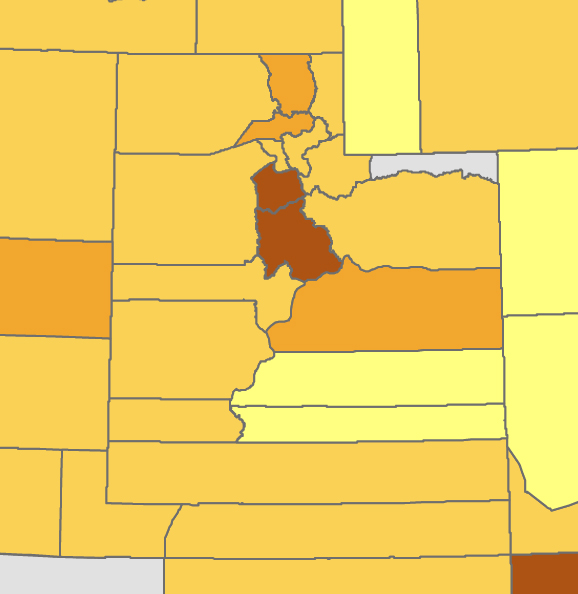
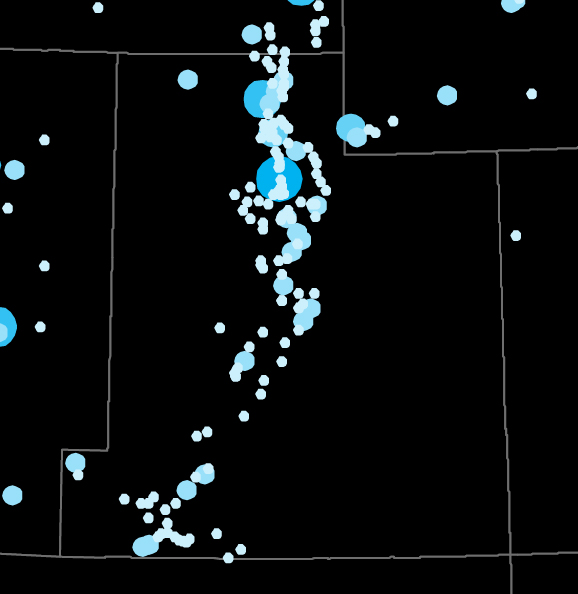
The result is a much more detailed regional geography than that of the U.S. Census. Look at Wyoming in both maps. In 1870, the territory was divided into five giant rectangular counties, all of them containing less than 5,000 people. But its distribution of post offices paints a different picture: rather than vertical units, it consisted largely of a single horizontal stripe along its southern border.
Similarly, our view of Utah changes from a population core of Salt Lake City to a line of settlement running down the center of the territory, with a cluster in the southwestern corner completely obscured in the census map.
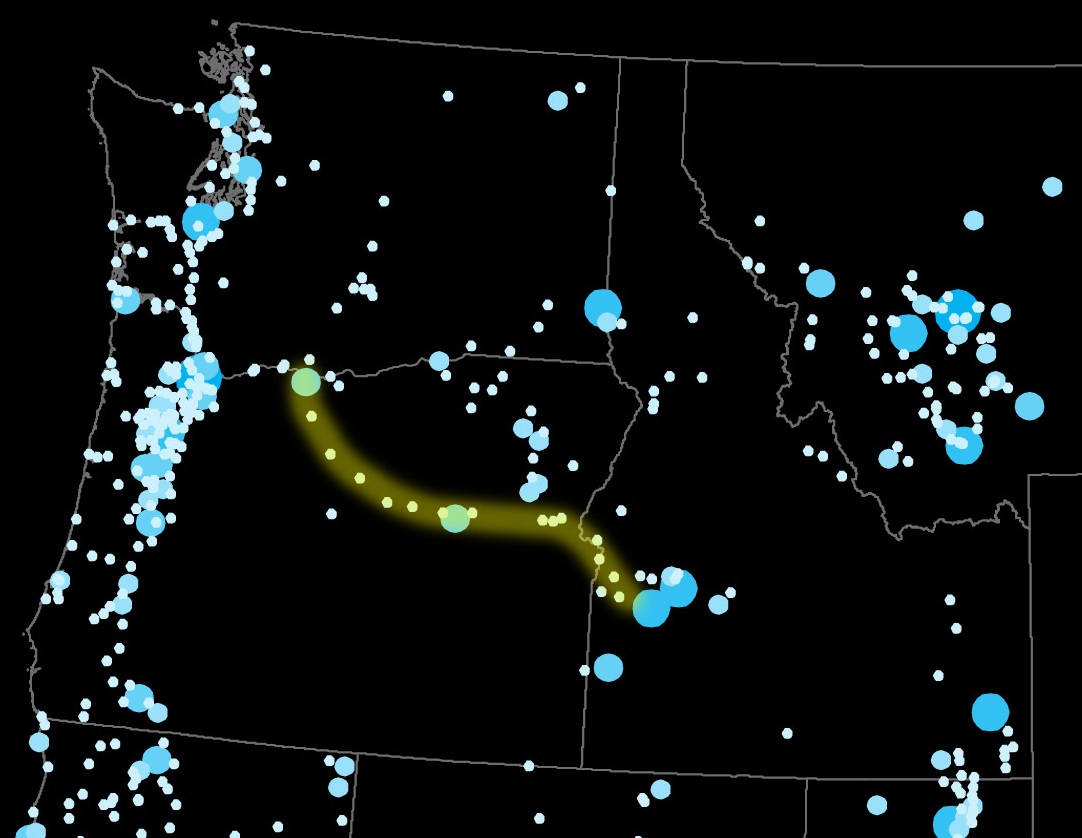
Post offices can also reveal transportation patterns: witness the clear skeletal arc of a stage-line that ran from the Oregon/Washington border southeast to Boise, Idaho.
Connections that didn’t mirror the geographic unit of a state or county tended to get lost in the census. One instance of this was the major cross-border corridor running from central Colorado into New Mexico. A map of post offices illustrate its size and shape; the 1870 census map can only gesture vaguely at both.
The following question, of course, should be asked of my (and any) map: what’s missing? Well, for one, a few dozen post offices. This speaks to the challenges of geocoding more than 1,300 historical post offices, many of which might have only been in existence for a single year or two. I used a database of more than 2 million U.S. place-names and wrote a program that tried to account for messy data (spelling variations, altered state or county boundaries, etc.). The program found locations for about 90% of post offices, while the remaining offices I had to locate by hand. Not surprisingly, they were missing from the database for a reason: these post offices were extremely obscure. Finding them entailed searching through county histories, genealogy message boards, and ghost town websites - a process that is simply not scalable beyond a single year. By 1880, the number of post offices in the West had doubled. By 1890, and it doubled again. I could conceivably spend years trying to locate all of these offices. So, what are the implications of incomplete data? Is automated, 90% accuracy “good enough”?
What else is missing? Differentiation. The salary of a postmaster partially addresses this problem, as the department used a formula to determine compensation based partially on the amount of business an office conducted. But it was not perfectly proportional. If it was, the map would be one giant circle covering everything: San Francisco conducted more business than any other office by several orders of magnitude. As it is, the map downplays urban centers while highlighting tiny rural offices. A post office operates in a kind of binary schema: no office, no people (well, at least very few). If there was an office, there were people there. We just don’t know how many. The map isn’t perfect, but it does start to tackle the county problem in the West.
Note: You can download a CSV file containing post offices, postmaster salaries, and latitude/longitude coordinates here.
